HOLIGILM free software for illumination calculation
Main HOLIGILM's features
Operating system
Microsoft Windows 98, 2000, XP, Vista or later
Guides
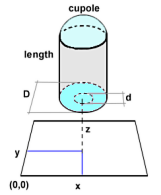
Up to 10 light-tubes in one room supported
Cupole - adjustable transparency
Tube - adjustable internal diameter and lenght, internal reflexivity
Optical interface - diffuse, transparent or combined; transparency adjustable
Room
Rectangular room supported
Orientation according to the north can be set
Workplane (rectangular area smaller than the room) supported for data visualization
Sun's position on the sky
Adjustable by setting Sun's azimuth and altitude, or
Automatic calculation of Sun's position from date, time and latitude of the room
Sky model
16 sky models implemented. Five models available in the free version of the program. Please, contact authors to obtain Pro-version having extended features:
1 CIE Overcast, 1:3 (I.1. ISO 15469:2004)
2 Overcast 1:3, thinner cloud layer (HOLIGILM Pro only)
3 Overcast 1:2, snow on ground
4 Overcast 1:2, thinner cloud layer (HOLIGILM Pro only)
5 Uniform, fog
6 Densely cloudy (HOLIGILM Pro only)
7 Cloudy (HOLIGILM Pro only)
8 Partly cloudy (HOLIGILM Pro only)
9 Partly cloudy, veiled Sun (HOLIGILM Pro only)
10 White, partly cloudy with Sun (HOLIGILM Pro only)
11 White blue (HOLIGILM Pro only)
12 CIE Clear, country side (V.4. ISO 15469:2004)
13 CIE Clear polluted, urban
14 Clear polluted, industrial region (HOLIGILM Pro only)
15 Clear, enhanced turbidity (HOLIGILM Plus only)
Numerical accuracy settings
Grid density (density of calculated points) of the room adjustable
Grid density (density of calculated points) of the optical interface adjustable (3 levels)
Grid density (density of calculated points) of the Luminous intensity solid plot (2 levels)
Illumination of the room and illumination of the optical interface can be displayed
Efficiency of the tube and assymmetry of its radiative pattern is calculated
Sky luminance plot implemented
Luminous intensity solid - 3D plot implemented
Color map (full-colour or grayscale, inverted) and/or isolines plots
Number of isolines and their values adjustable
Workplane (rectangular area smaller then the room for which the data are visualized) can be defined; whole room or workplane only can be shown in plots
Logarithms of the illumination can be shown in plots
Upper limit of the illumination can be set in plots (ellimination of hot-spots)
Arrow pointing to the North can be shown in plots
Plots can be fully customized using custom GNUplot commands
Export of plots into popular bitmap (GIF, JPG, PNG) and vector (WMF, EPS, LaTeX) graphical formats
Font type and size used in plots editable
Other options and setings
Font type/size used by program selectable
Size of dialog windows adjustable
User manual and "Working with graphs" manual included