Results so far
Thesis objective 1
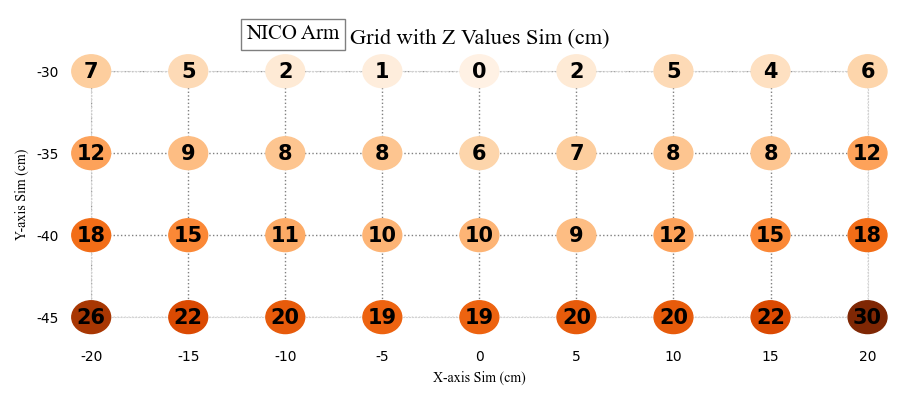
Visualisation of manually measured z values (height) of touchscreen in grid-based points in simulation. Real NICO will touch the screen at point (x,y) from the grid if we set the goal z based on the corresponding z value in this grid. We can see that the differences are roughly symmetrical with respect to x axis:
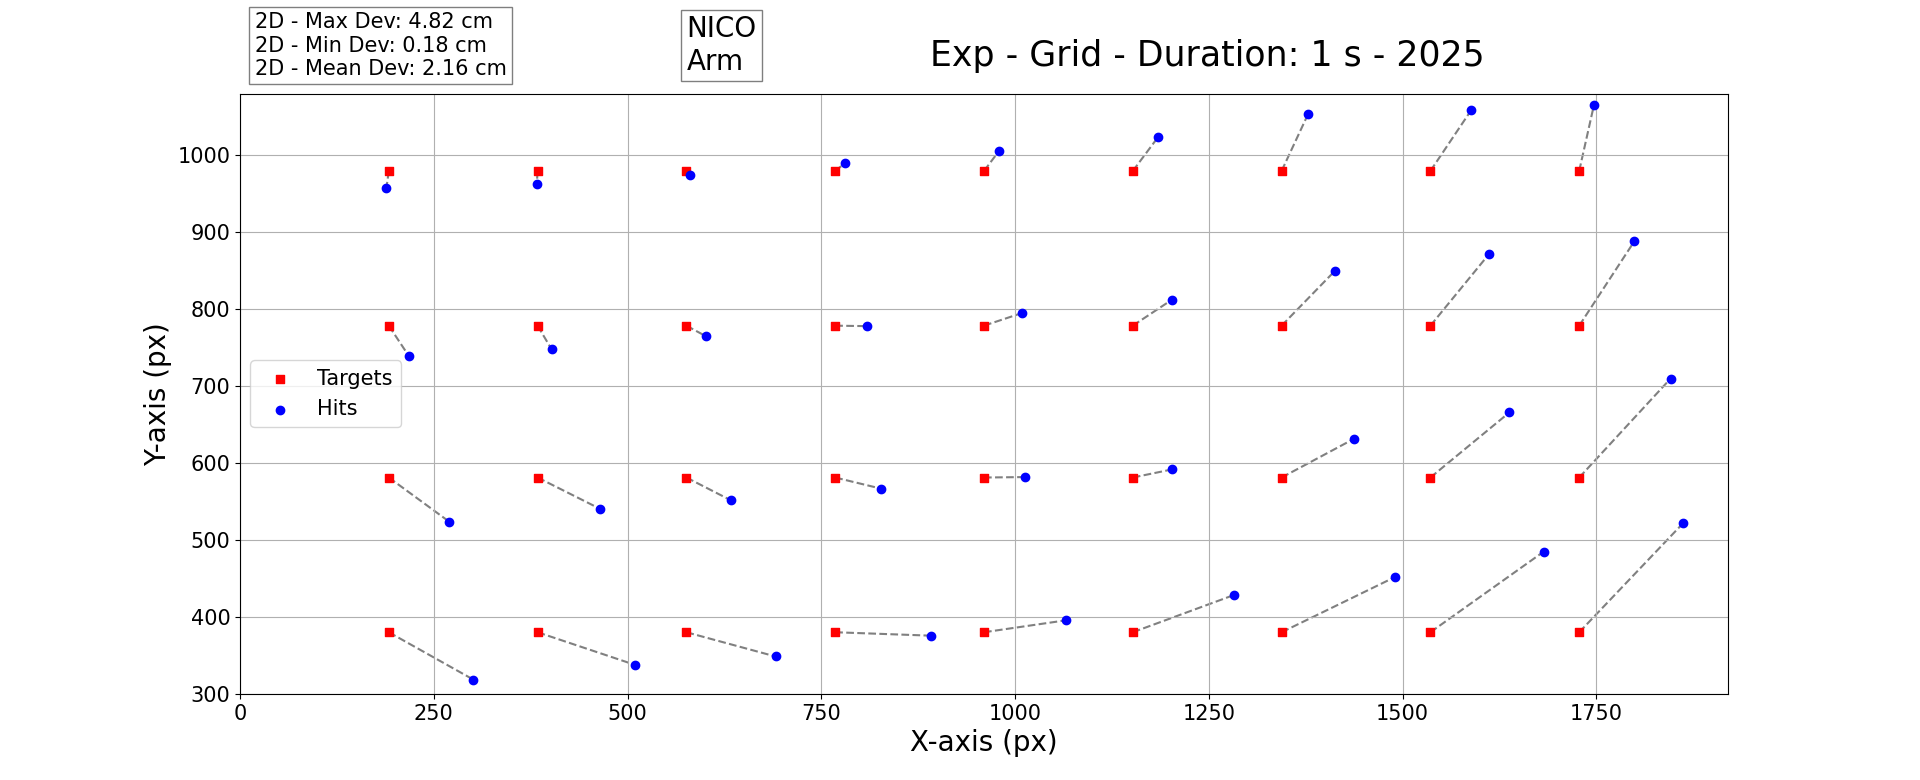
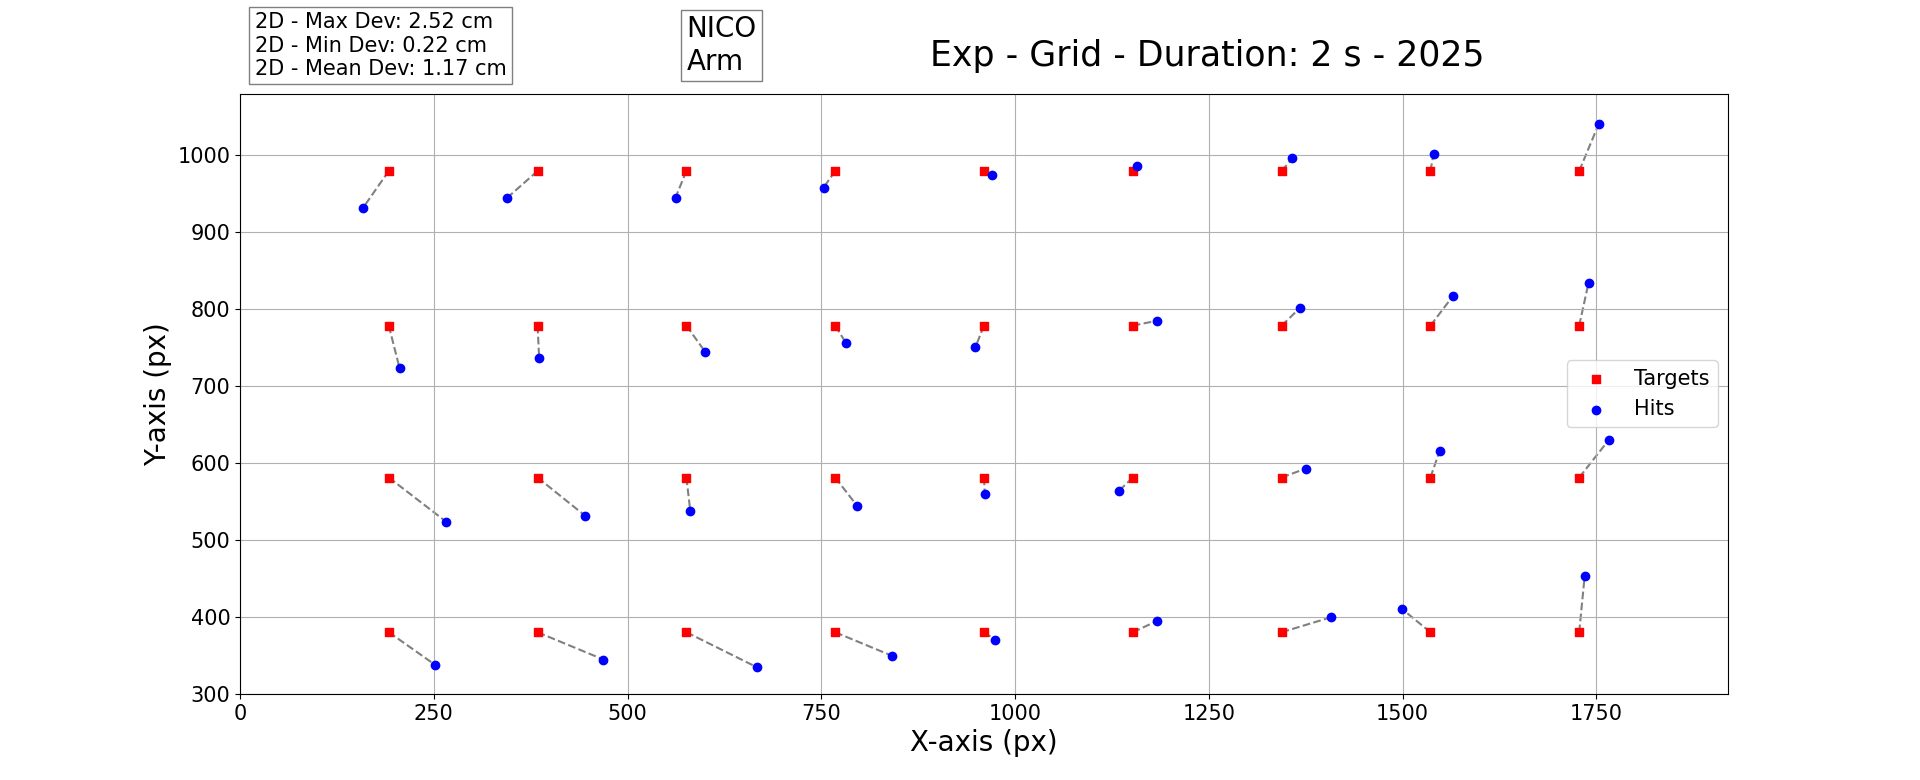
Plot of deviations of hits (blue) from grid-based targets (red) in the physical space (on the touchscreen). We used the model M1 and NICO arm movement of 1-sec (top) and 2-sec (bottom) duration. The box "NICO Arm" denotes the base position:
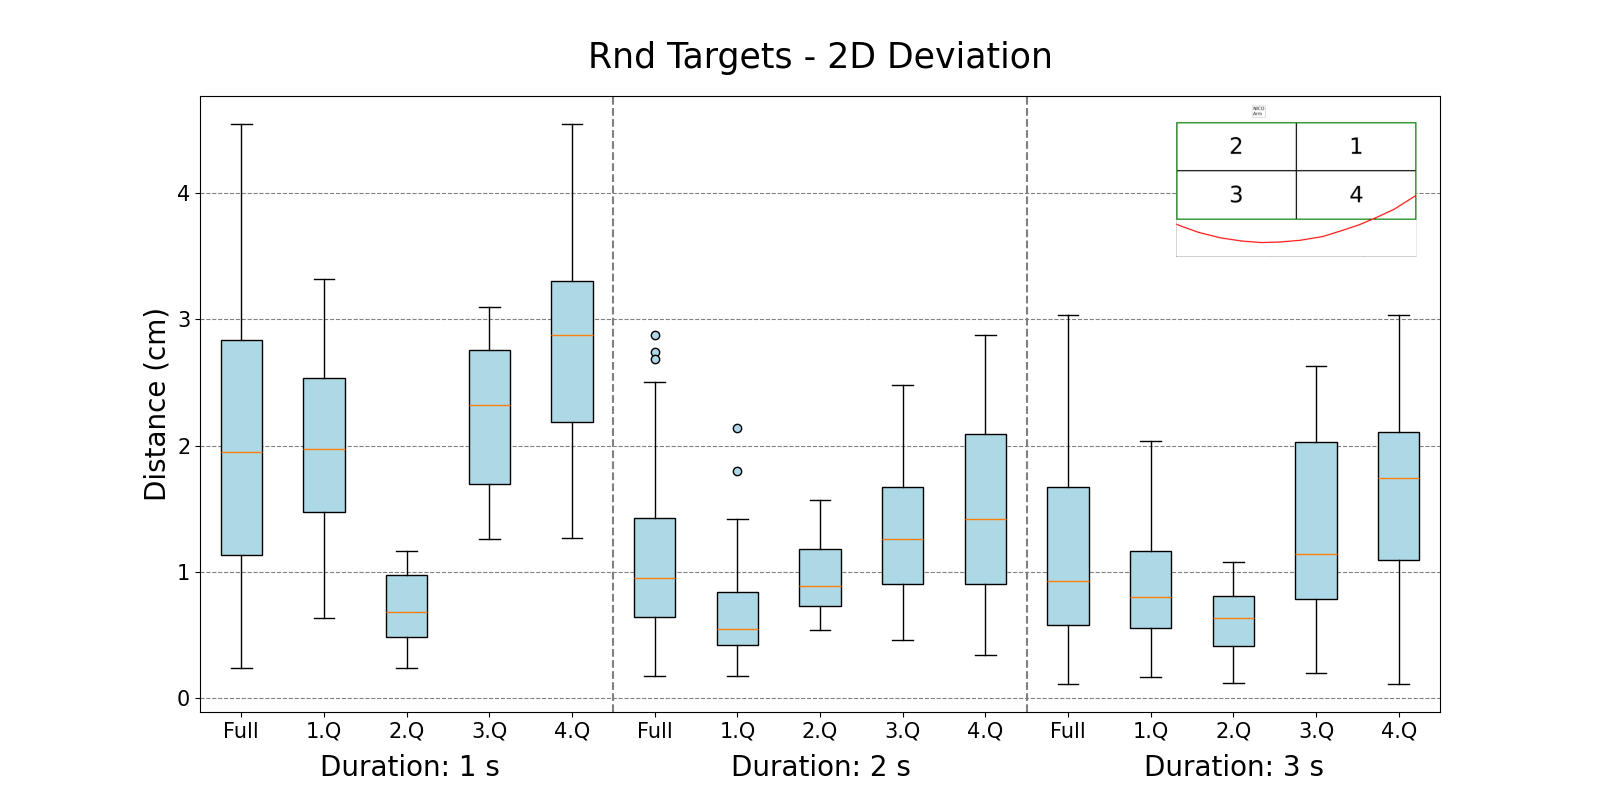
Comparison of 2D deviations of hits from random targets within four quadrants for three durations of movement. Targets were calculated using M1. Small inset image top left shows the NICO reach limit (red line) and partitioning of the testing area:
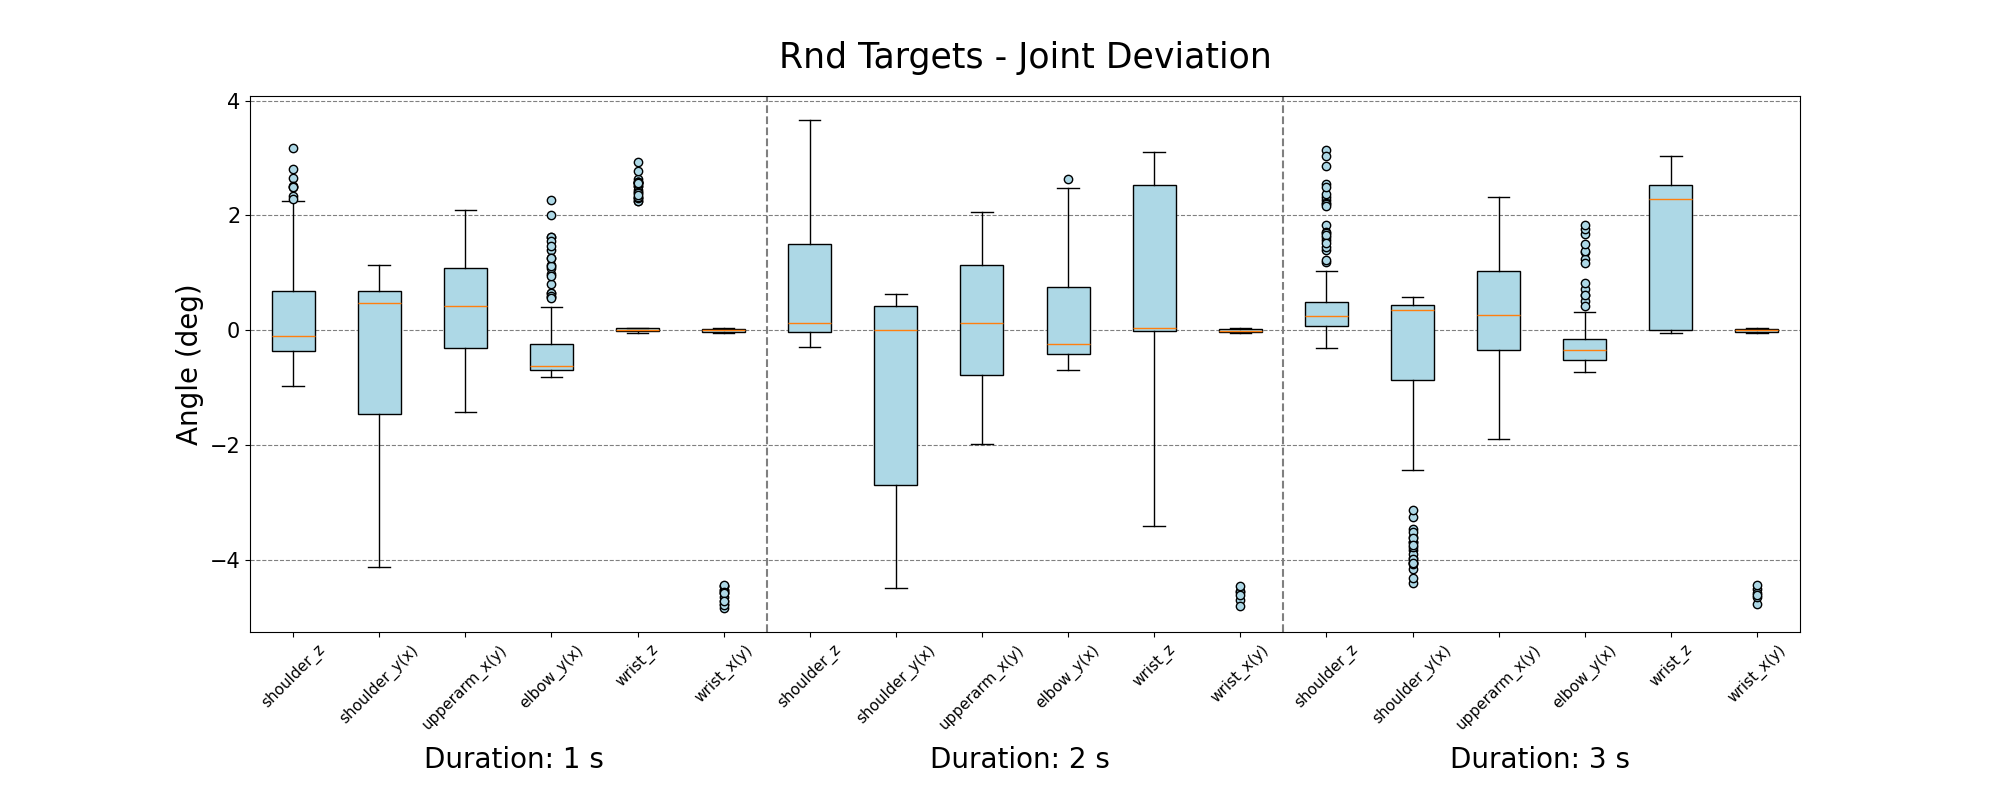
Comparison of joint angle deviations for three different durations of movement. Joint deviation is calculated as a difference of joint angles returned from inverse kinematics (angles sent to robot) and joint angles read from the robot after the end of movement (using M1):
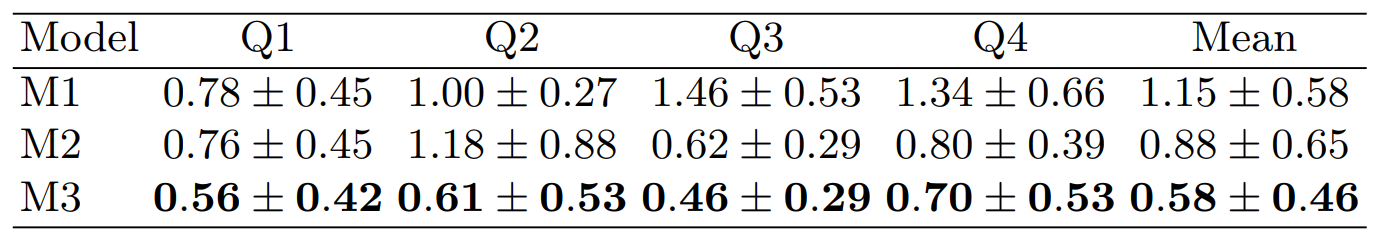
Accuracy of NICO robot 2-sec movement in 4 quadrants using our three models. Each cell contains the mean error and the standard deviation in centimeters:
Comparison of 2D deviations (Euclidean distances) of individual model predictions for random targets:
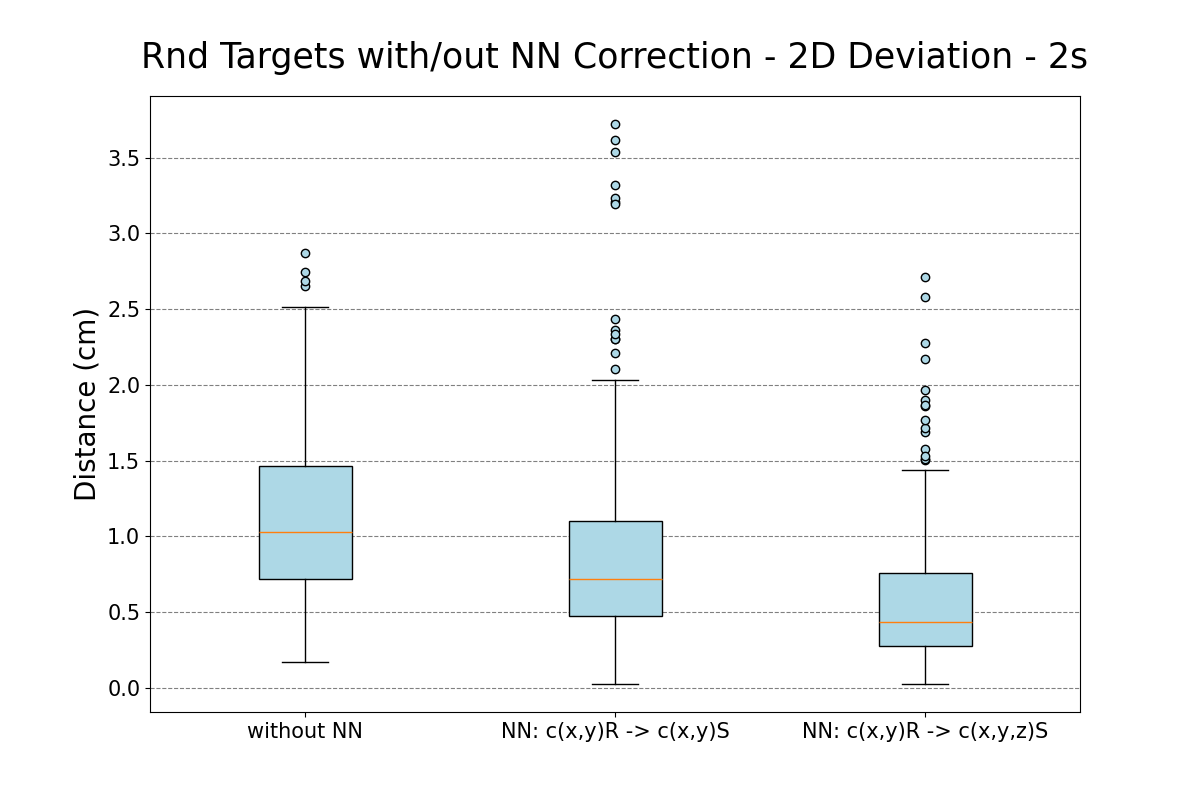
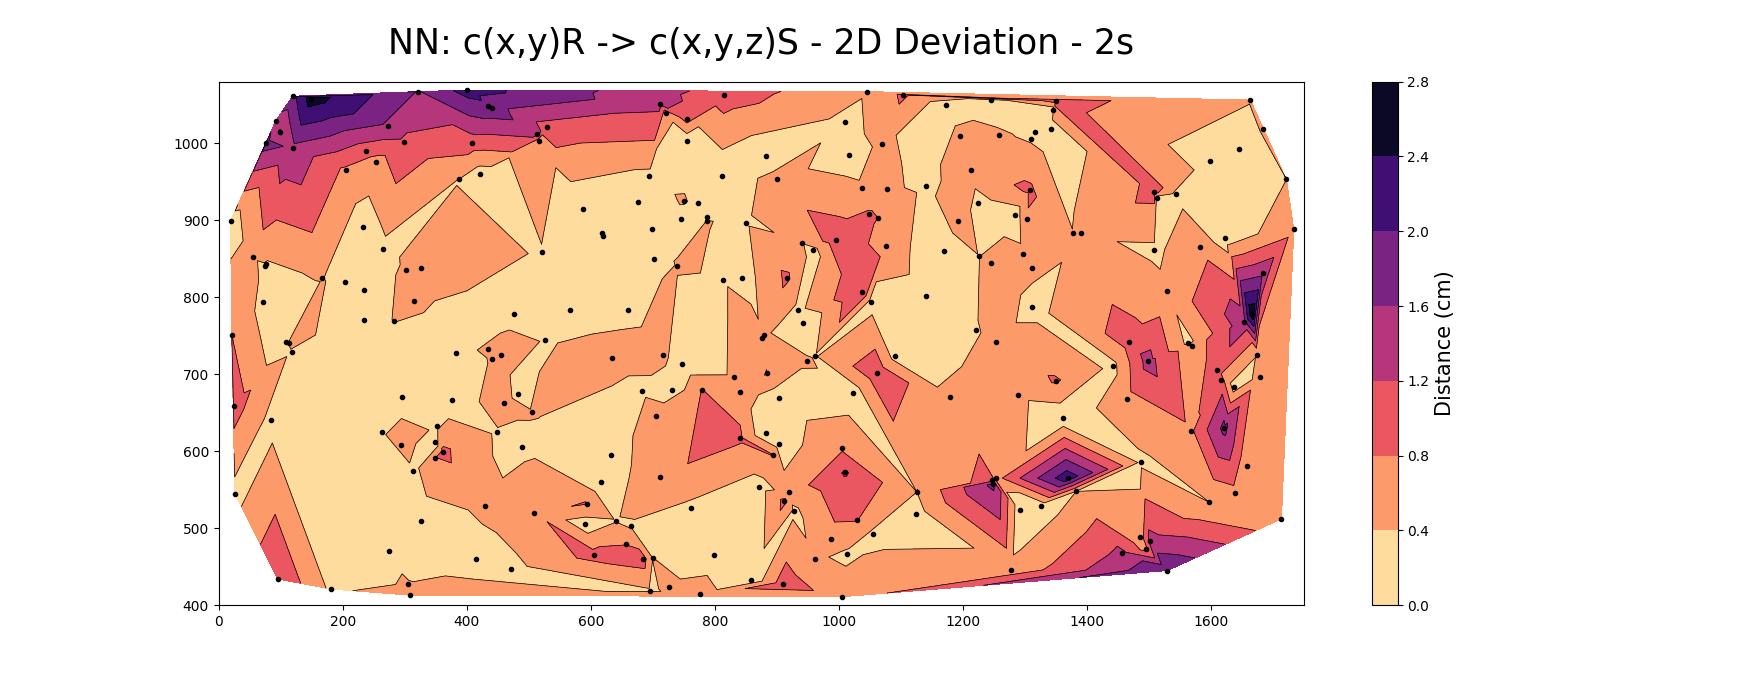
Accuracy of NICO robot after the neural network based correction, trained to predict 3D points in the simulator space from target 2D points on the touchscreen. Accuracy is calculated as a deviation in 2D space:
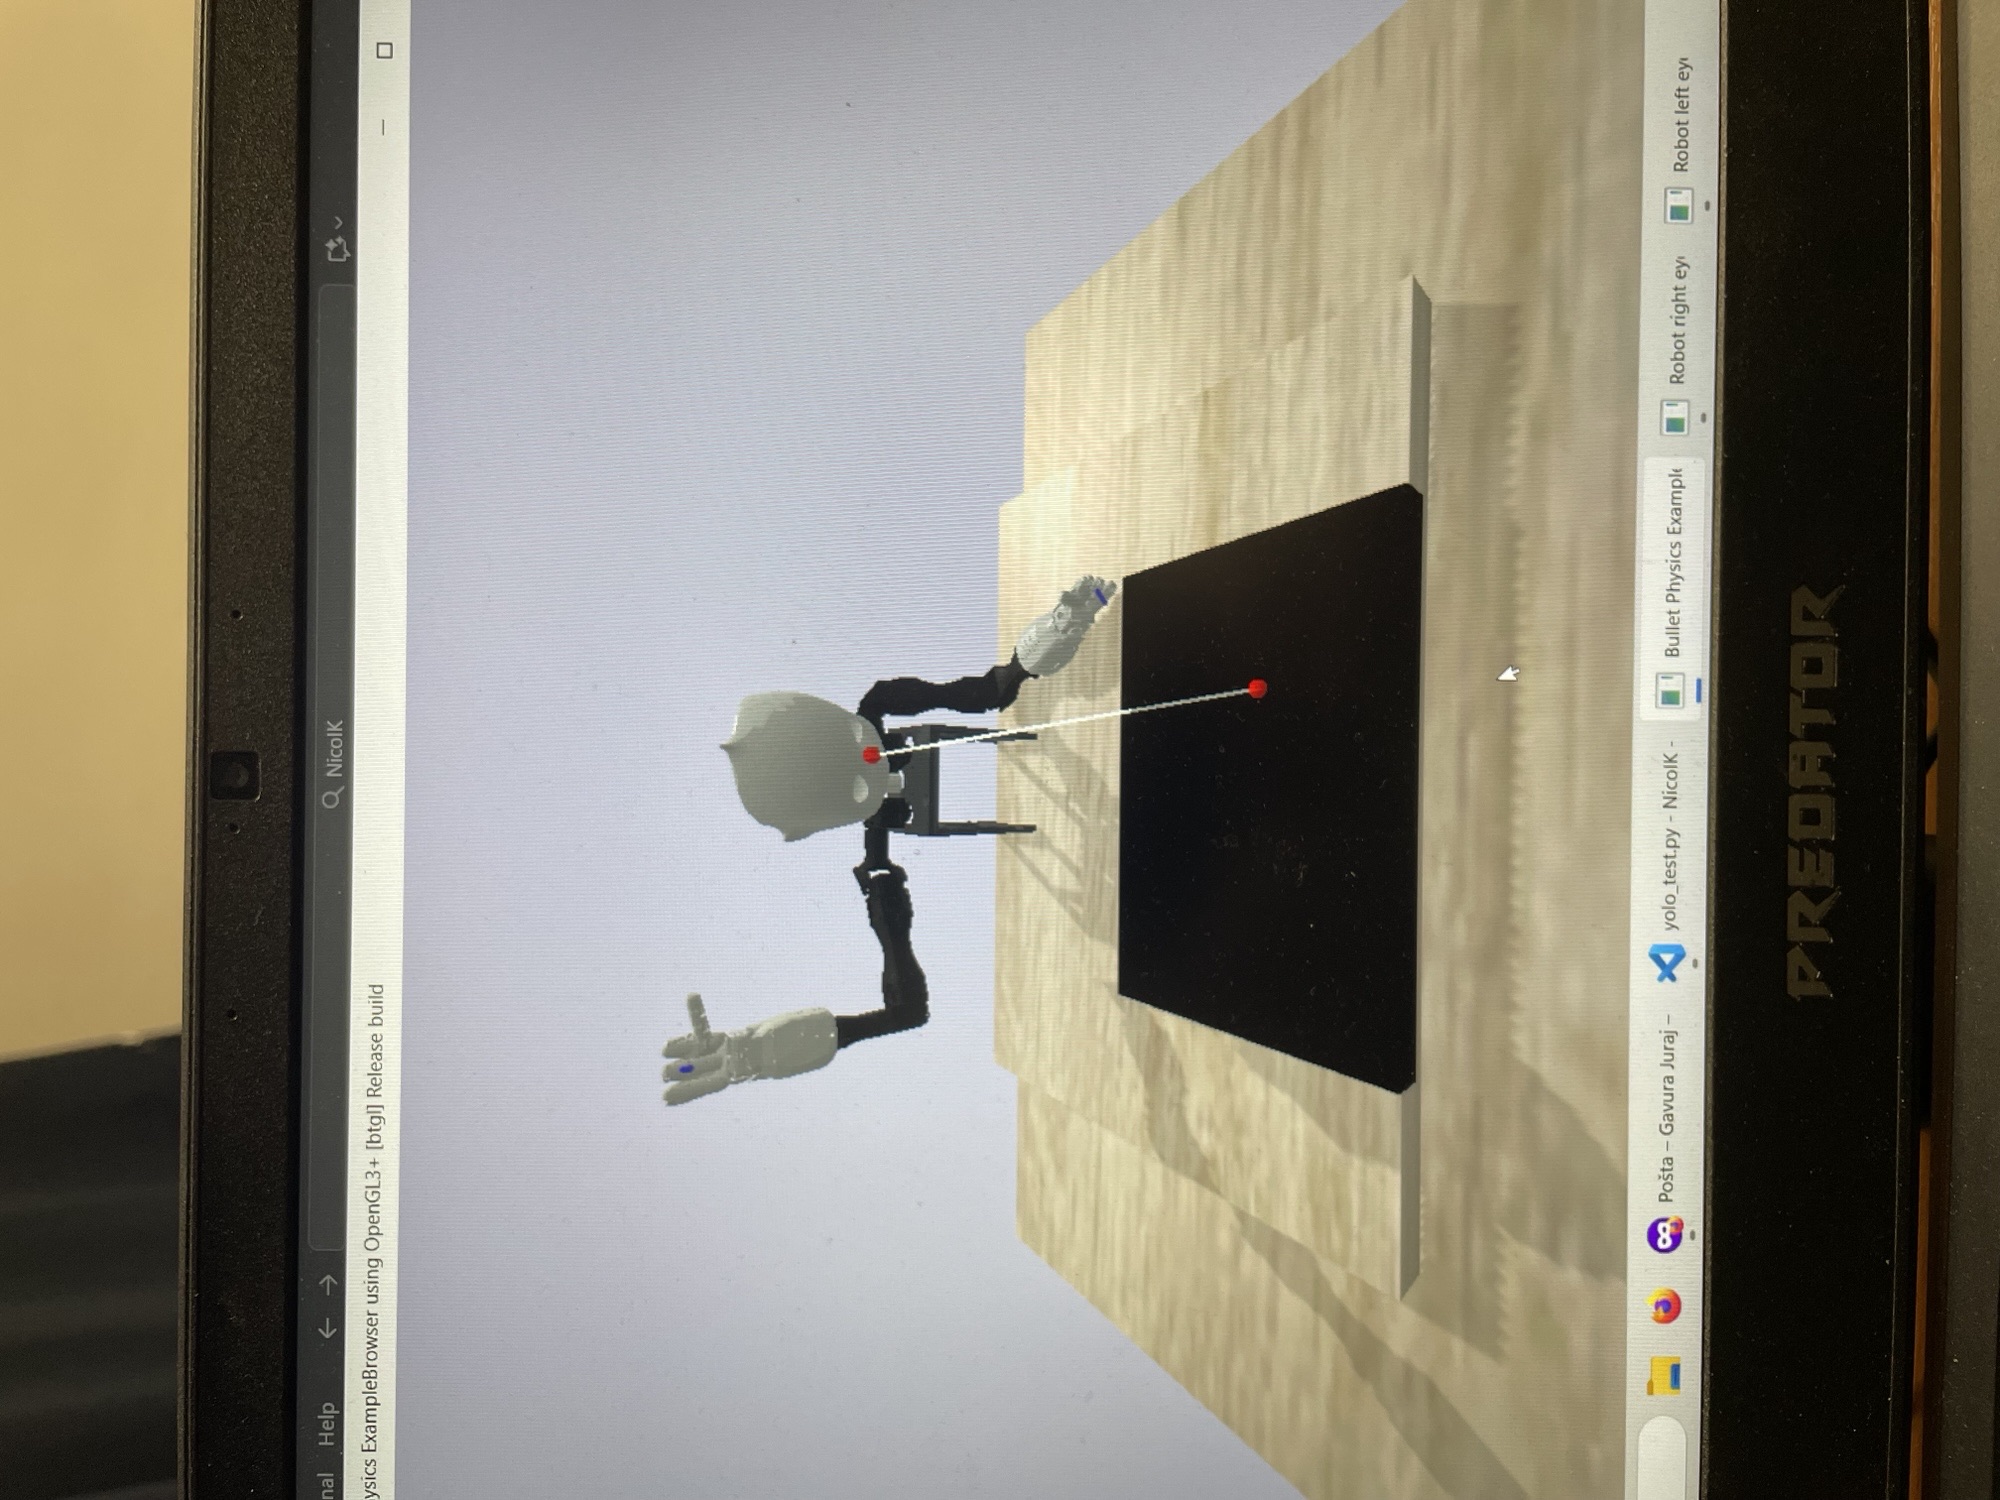
NICO in action:
Thesis objective 2
YOLO test:
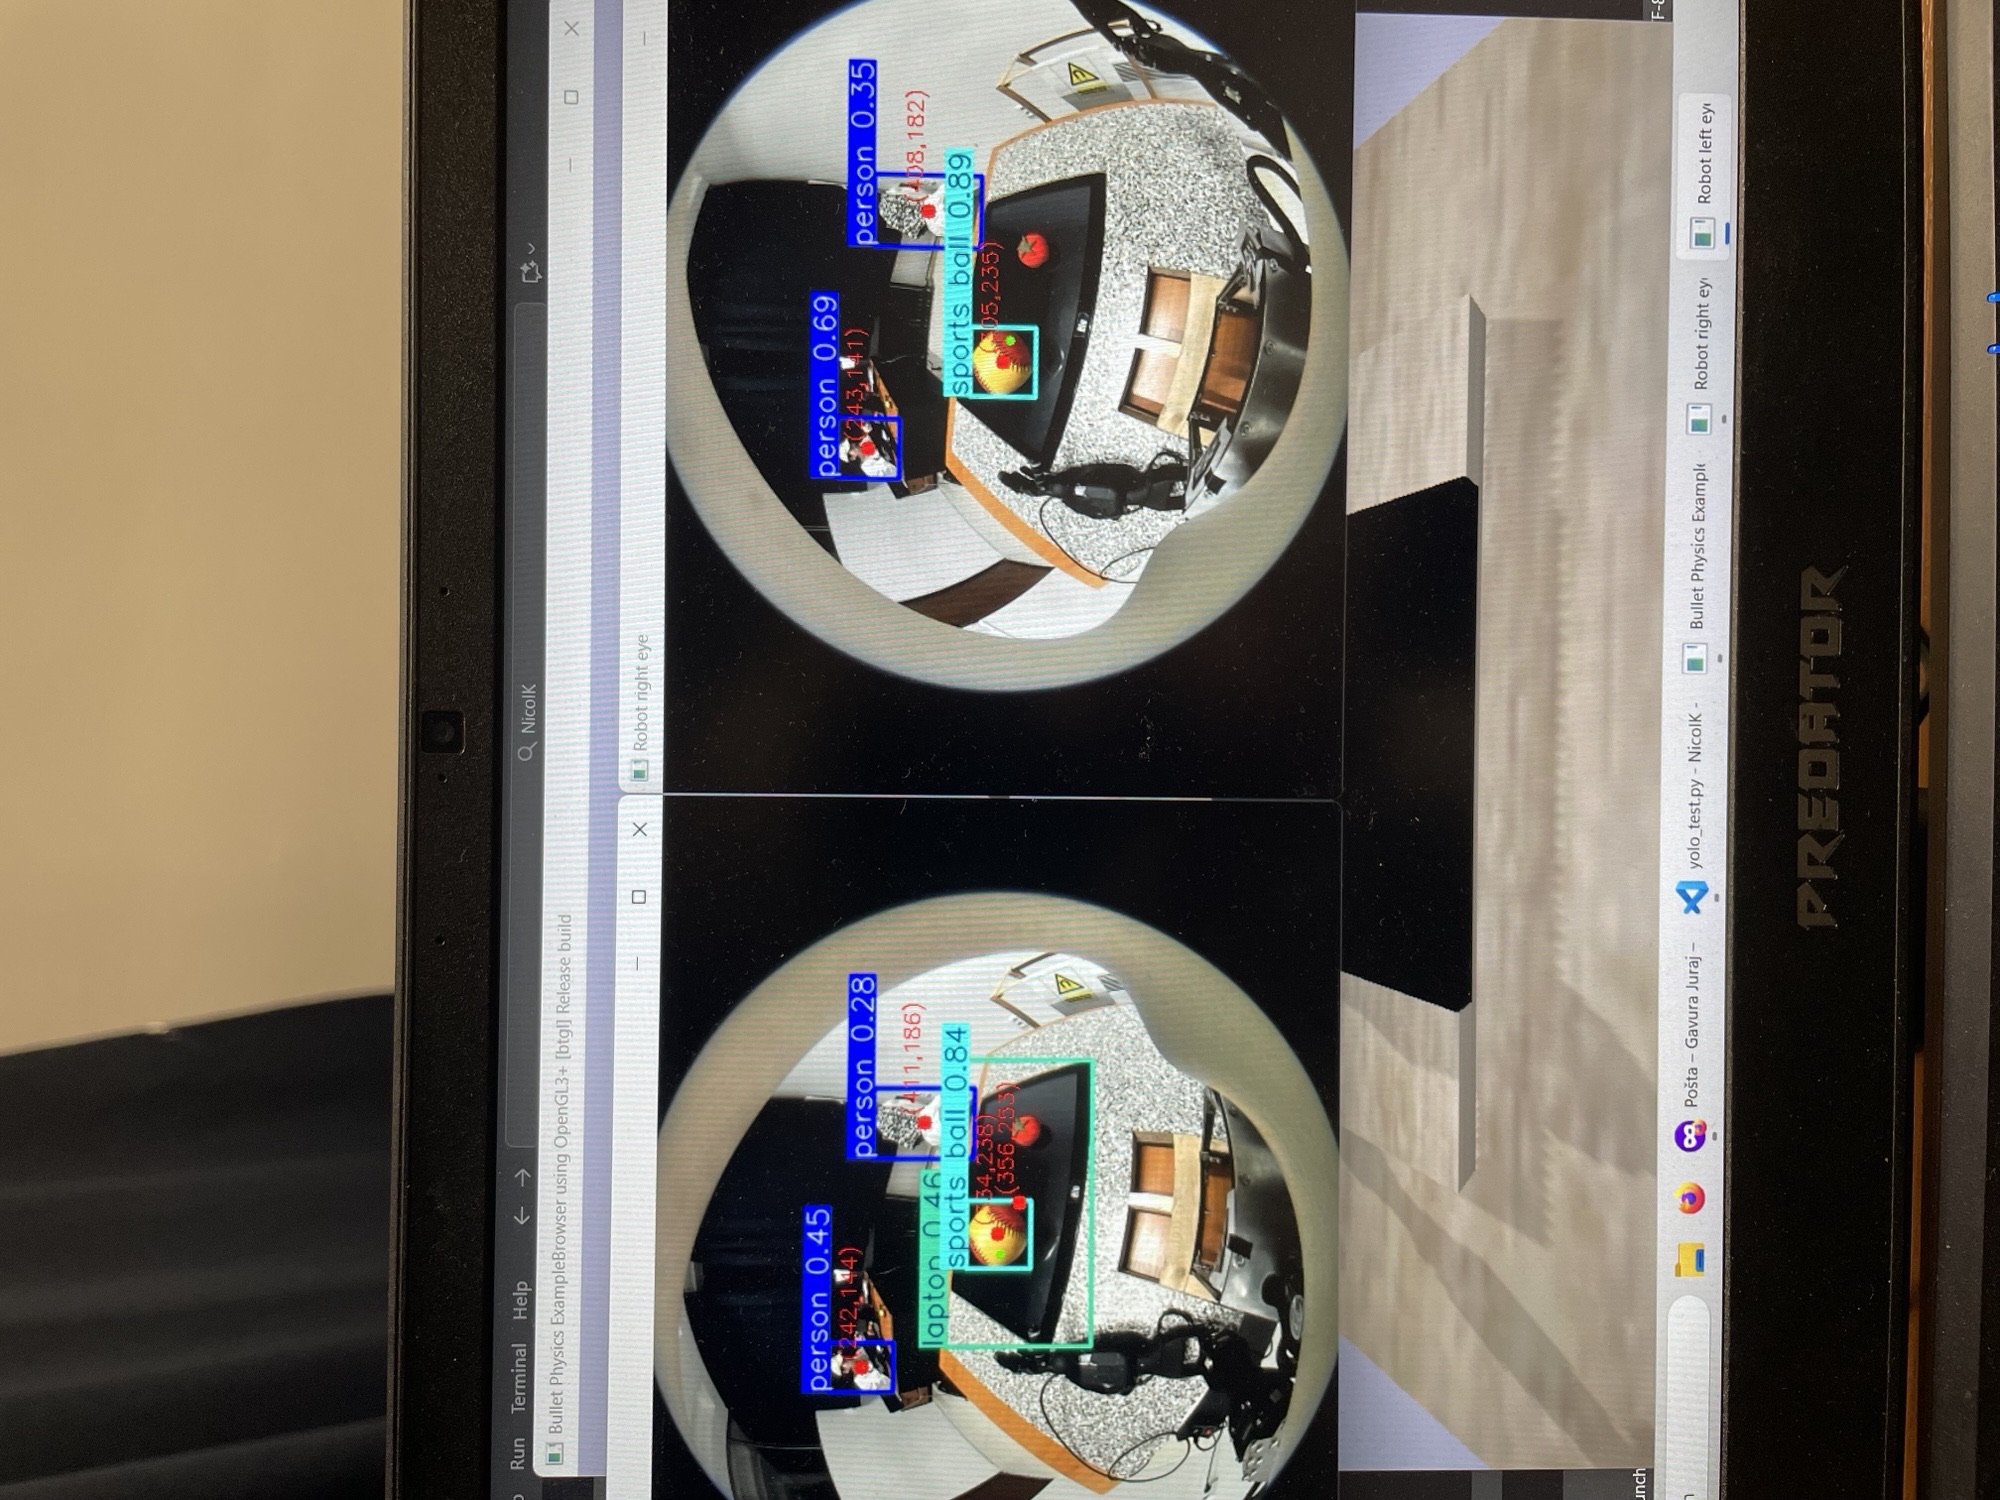
NICO finding the exact 2D position of an object he is looking at: