Graphical User Interface
The first step in creating a GUI is a console application that has full functionality - it must allow to set the measuring positions (sensor orientations) and type of measurement (which filters to set). Then the application must autonomously perform measurements for each position and save the measurement results to a file. After testing the application and its recovery in various situations (including hardware problems such as disconnecting USB cables or restarting the computer) it is possible to proceed to the creation of the GUI itself.
The measuring cycle represents two nested cycles: outer through the head positions and inner through the filters. Practically the same sets of head positions are used repeatedly, such as a whole-sky 10-degree scan or a meridian scan from the horizon to the zenith. Therefore, different sets of measuring head positions are prepared by the user in advance in simple text files, where in each line there is a pair of numbers elevation, azimuth entered in degrees. An example is a set of positions of a meridian scan from the horizon to the zenith using step of 10 degrees.
The situation is similar with such type of measurements, that are also performed repeatedly. An example could be the masurement of the spectrum or the measurement of the polarization of light at a certain wavelength. Therefore, we also define the type of measurement in a separate text file. The structure is shown in the file for the measurement of the spectrum. The first line of the file is copied automatically to the output file as a header-line of the results of the measurement. Next lines contain commands for the measuring head . In our example, these are just commands for setting up 'SFL' filters and GSV measurement commands. The program writes each value obtained by the measurement to the output file, the individual measured values are separated by a tab. Obviously, the first line should have as many tab-delimited texts as there are 'GSV' commands in the next lines.
This result in a formatted data file , where the first row represents the column headings, zenith angle and azimuth are the first values in rows. The data format is compatible with MS EXCEL and programs for drawing graphs in polar coordinates (the zenith angle then represents the radius).
In contrast to the event-controlled GUI, our console program is linear. The following steps are performed step by step:
- Automatic identification of the ports to which the mount and the measuring head are connected
- Reset (synchronisation) of the carousels
- The user selects (using a dialog) files of position and type of measurement as well as the output file
- The user can send manually any commands to the measuring head, for example he can set the appropriate gain for the given lighting conditions
- Automatic measurement starts, it can be paused if, for example, a temporary light source appears
- At the end, the carousels will be reset (synchronised). Both carousels should have the status 'ISOK', otherwise the measurement failed.
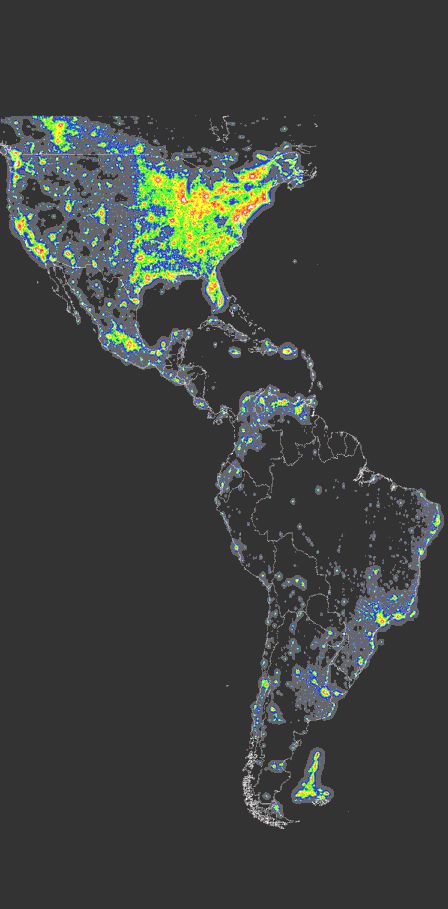
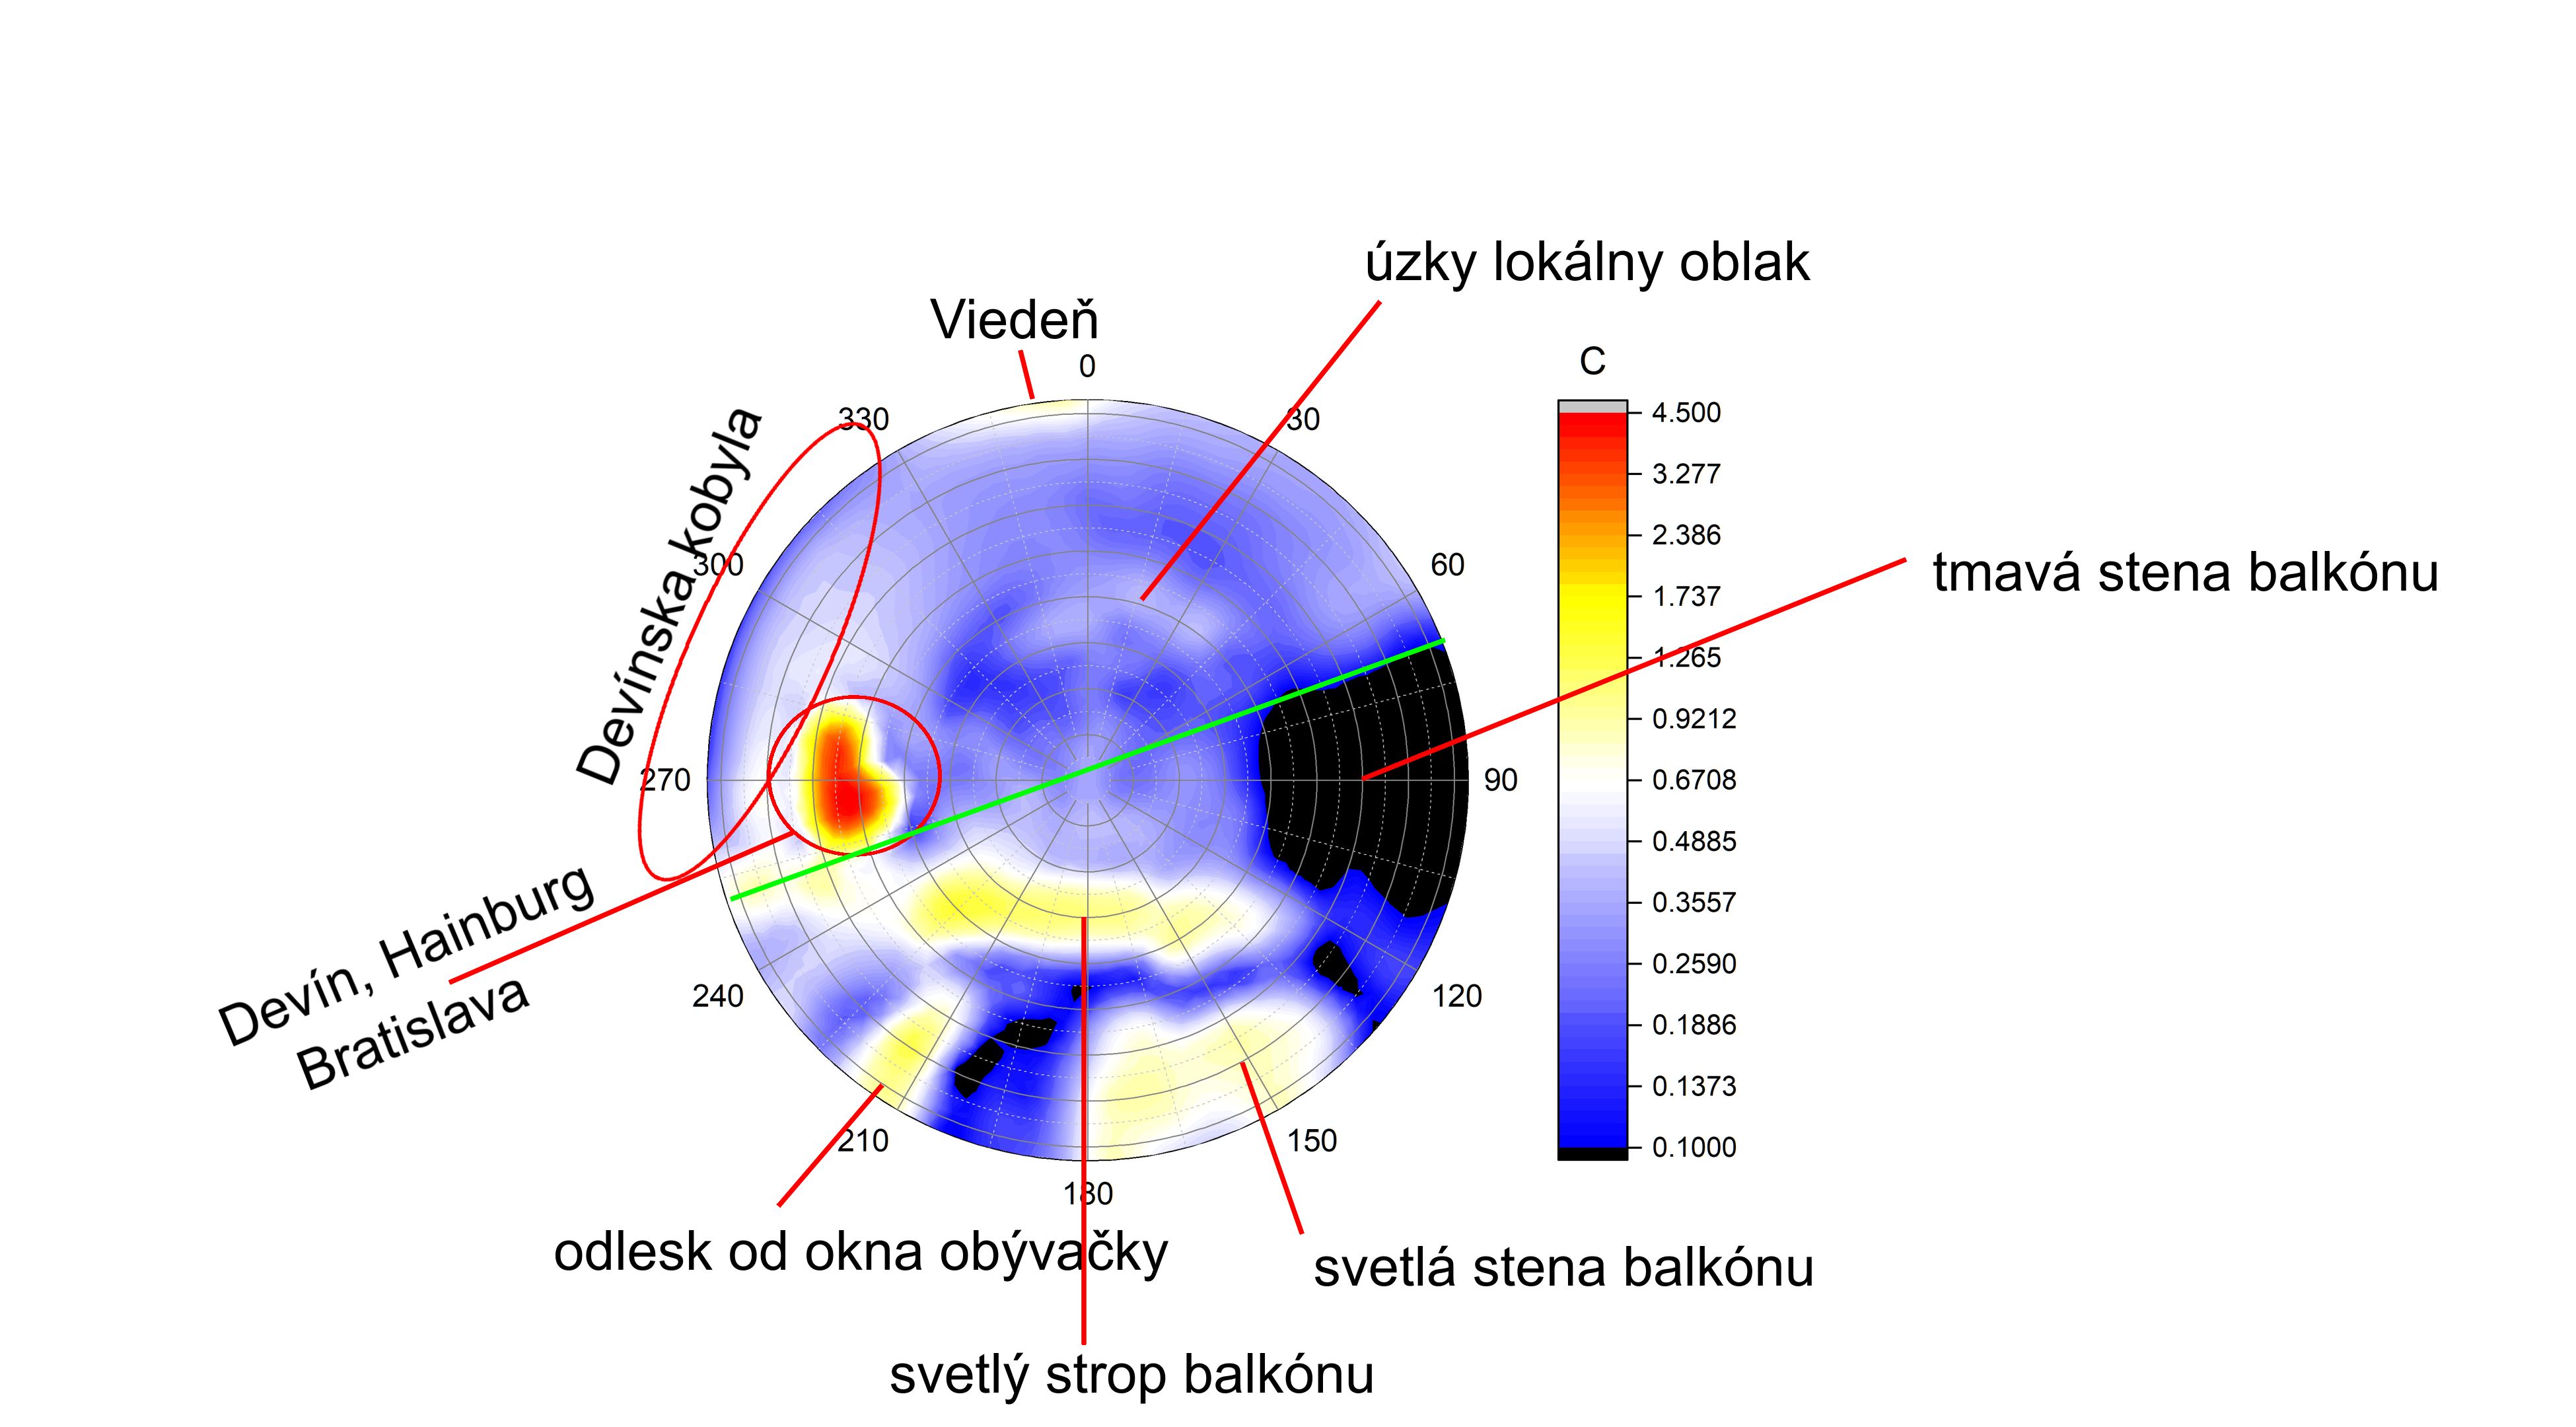
To illustrate the functionality of the entire system, we present a full-sky scan of the integral brightness of the sky across all wavelengths. The scan has a resolution of 7 ° x7 ° ;. The figure explains the cause of the main visible objects. The green line roughly separates the sky from the walls of the apartment and the balcony. Some walls and windows were illuminated by street lighting.
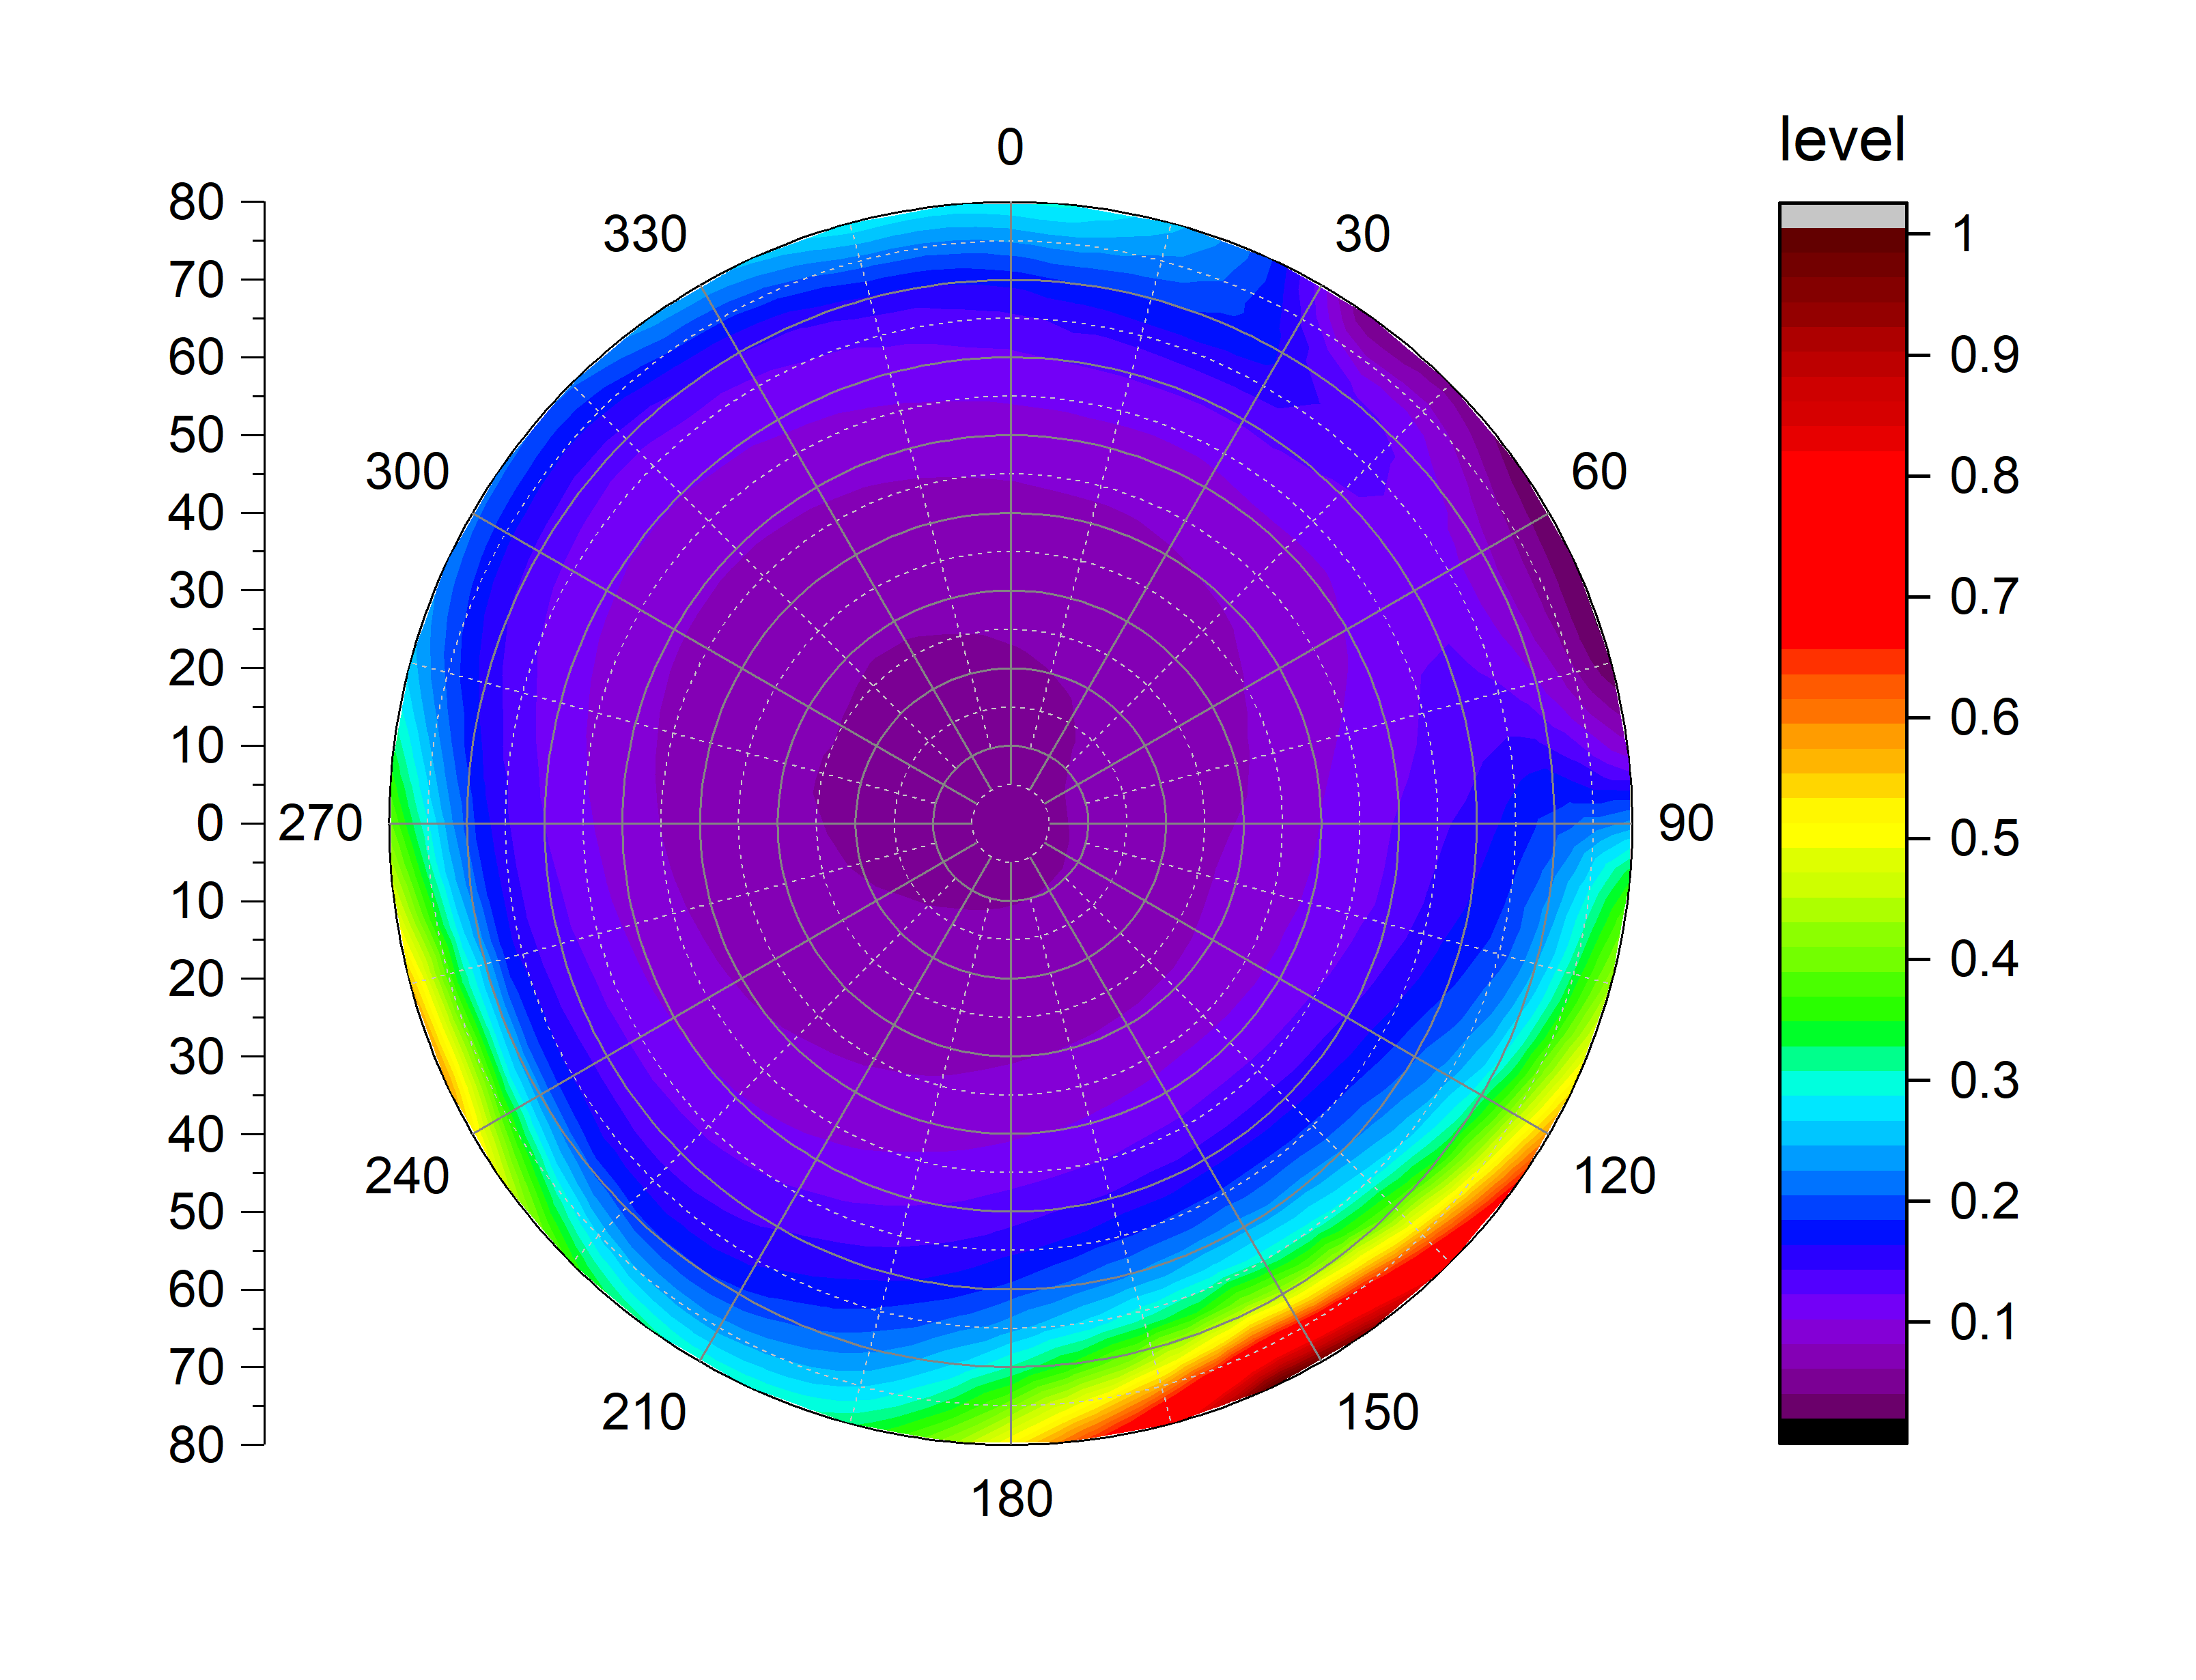
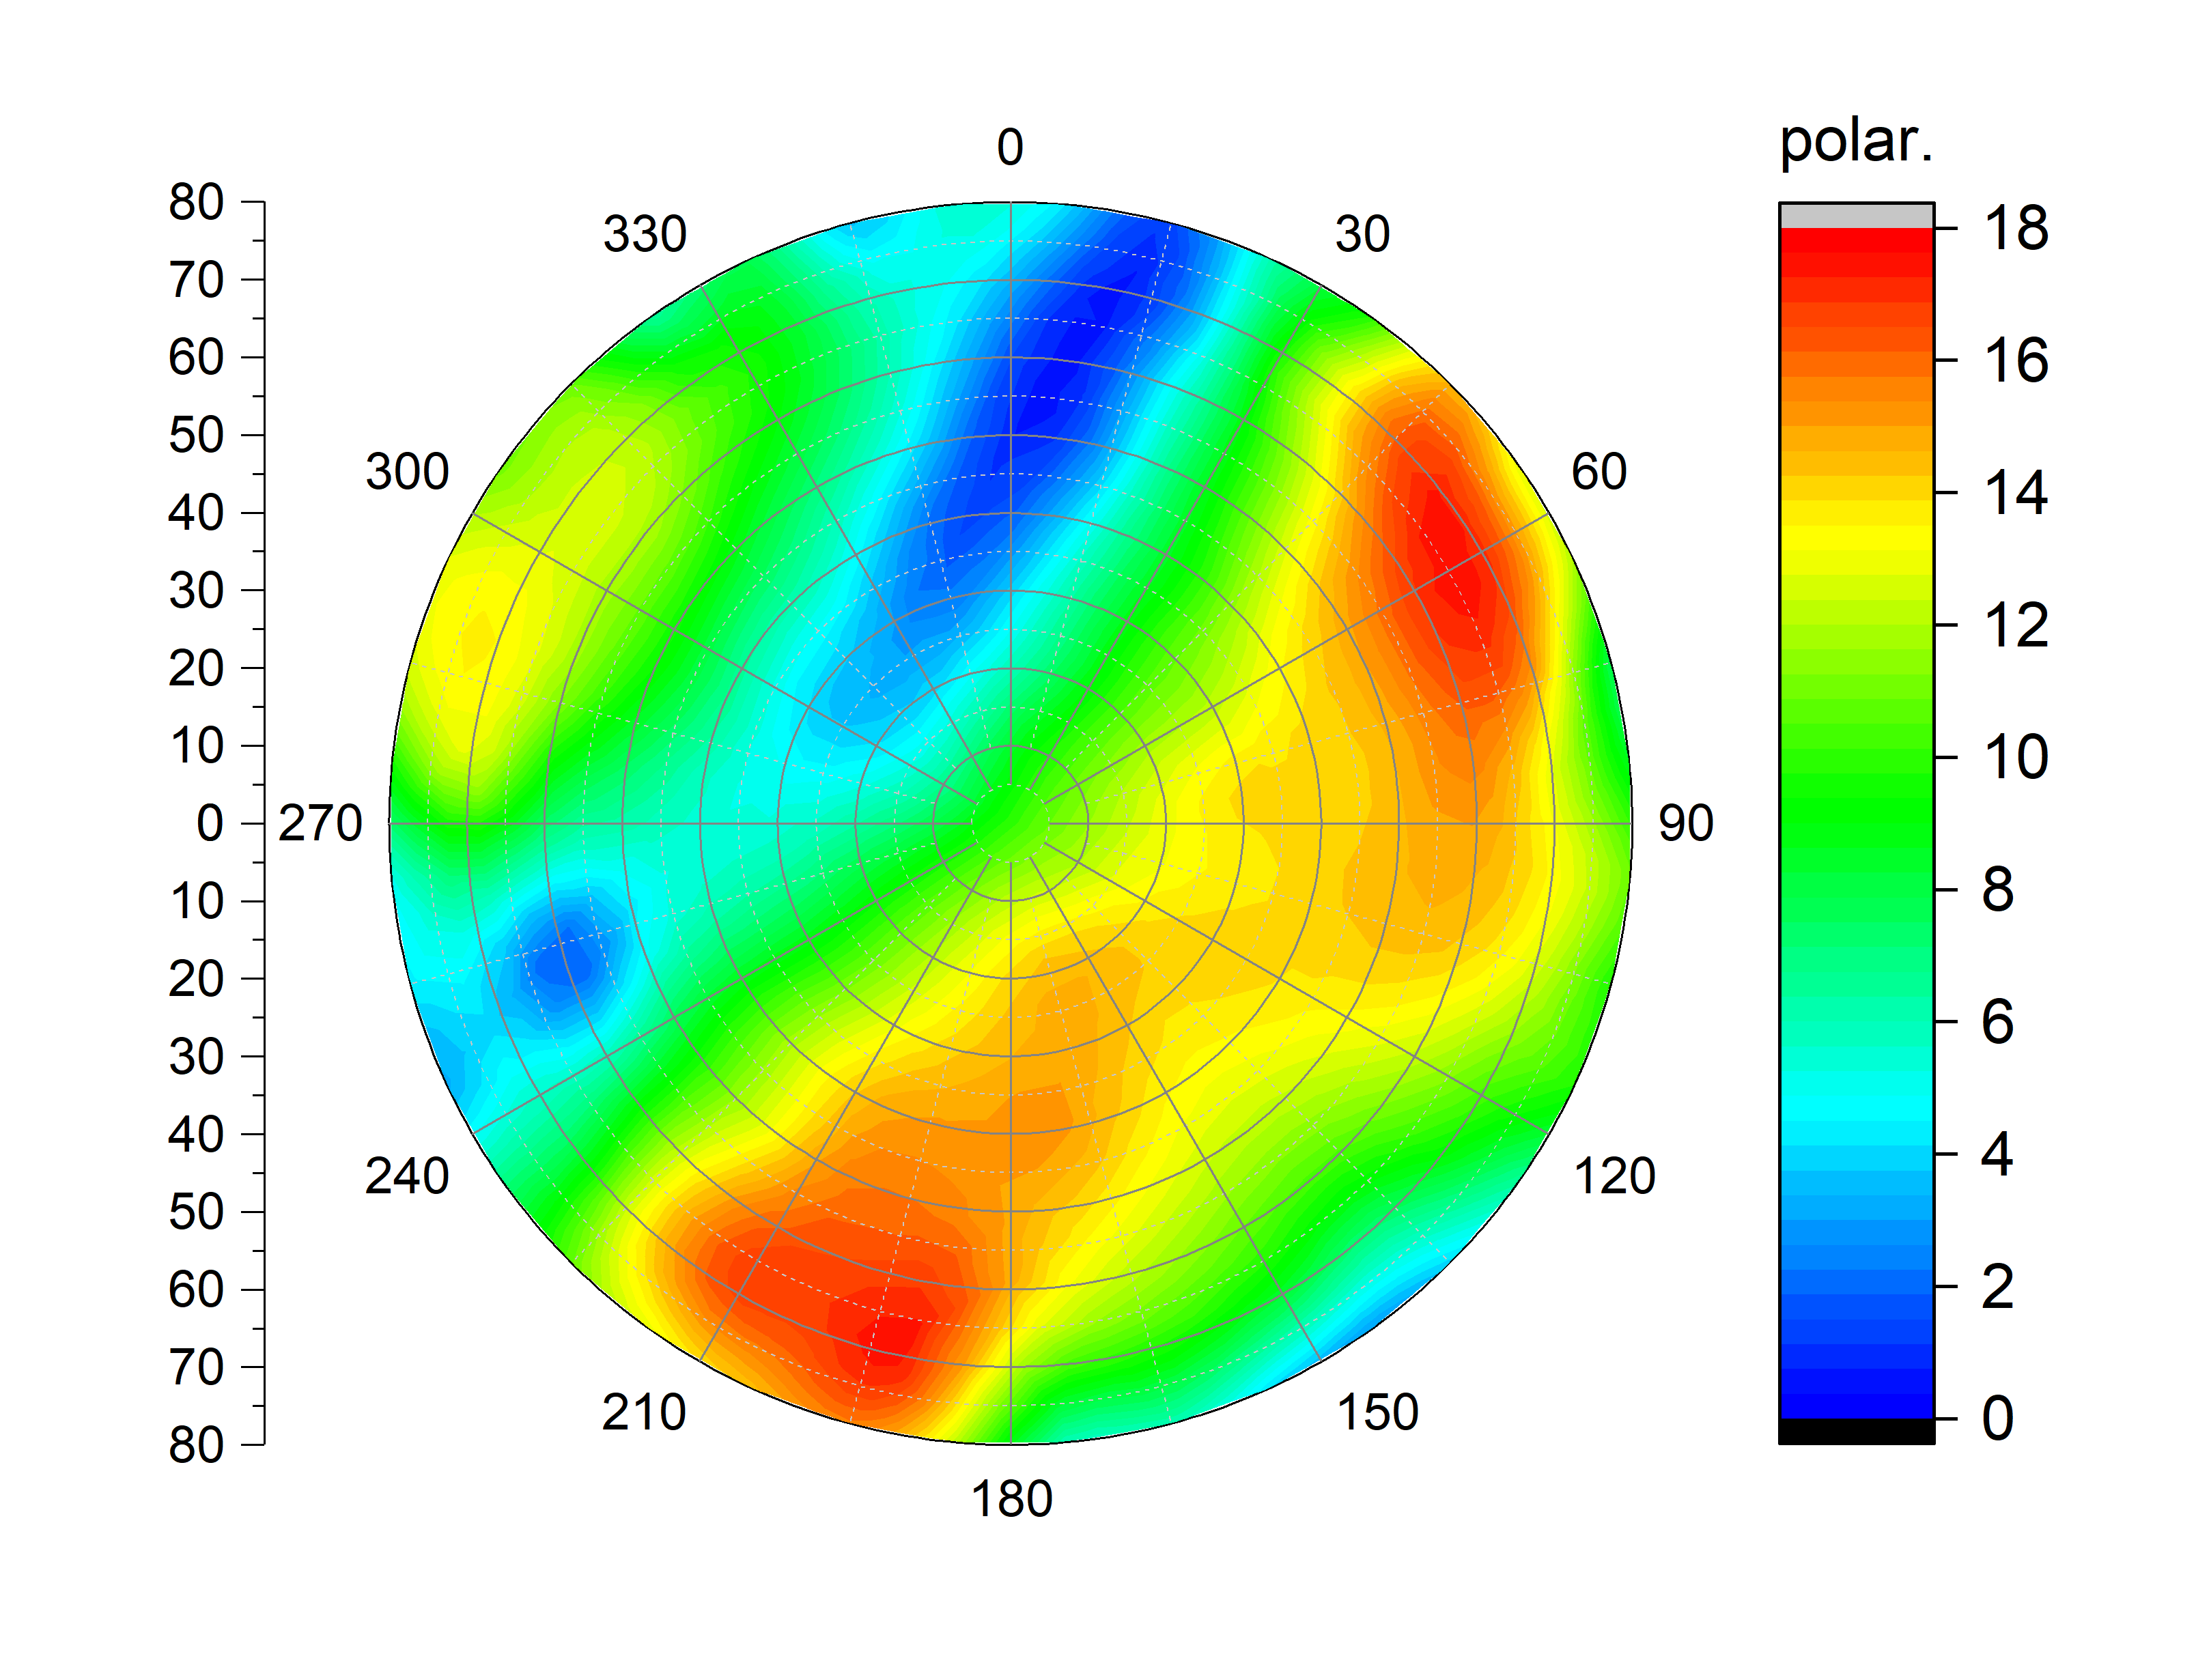
Example of the measured brightness of the sky (left), the degree of polarization (in the middle) and the polarization angle (right) of the night sky around the city of Lab:

The complete program is on this link .
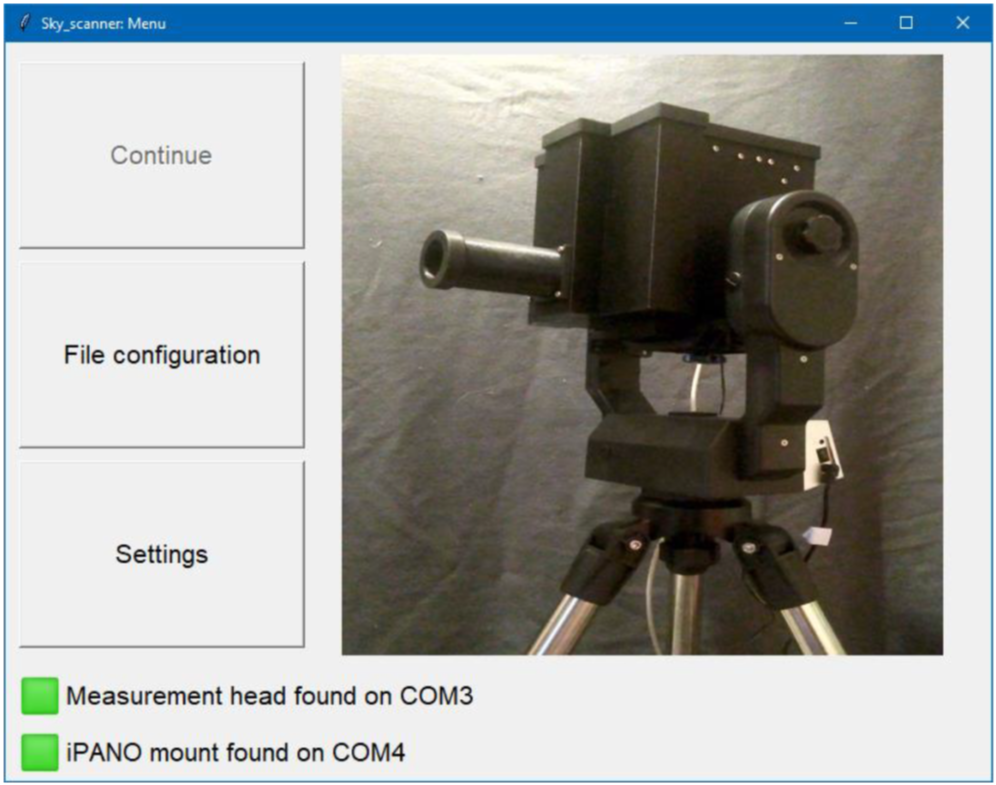
After testing the console version of the program, we started creating the GUI. The basic window allows you to continue an interrupted measurement, or go to the settings of a new measurement:
The "Settings" section allows manual setting of all device parameters (choice of filters, sensitivity of the photomultiplier, number of averaged measurements, setting of the minimum temperature for starting heating):

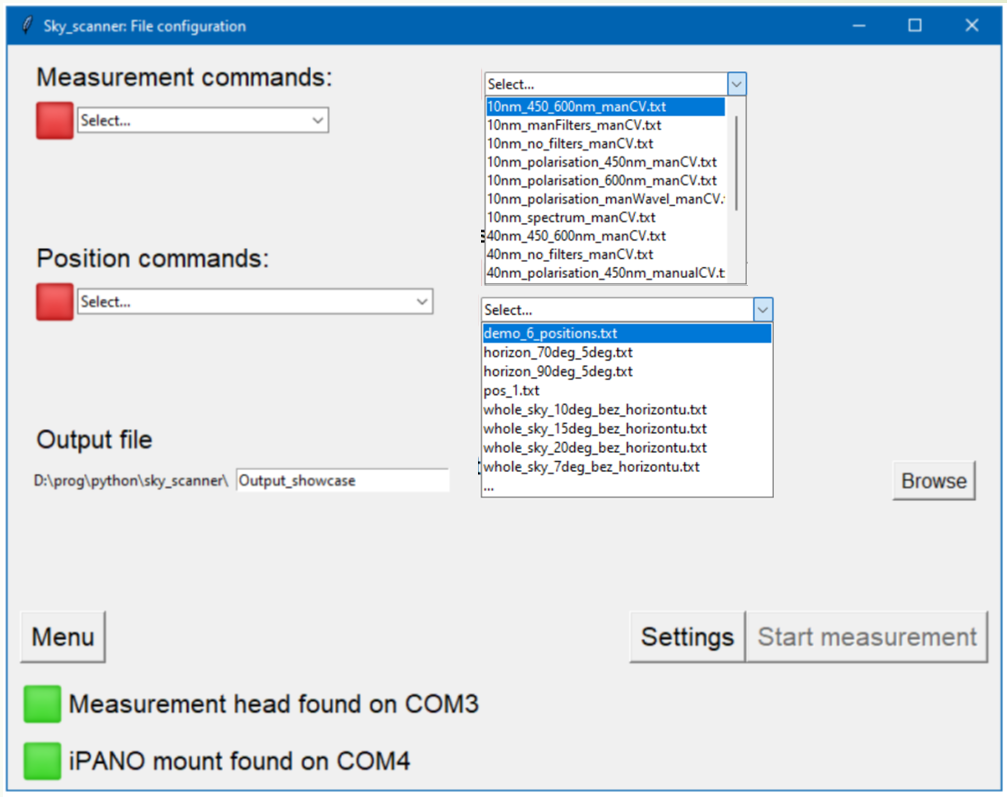
The "File configuration" section allows selection of pre-prepared measurement positions (for example, all-sky scan with different resolutions) and pre-prepared measurements (for example, spectrum or polarization):
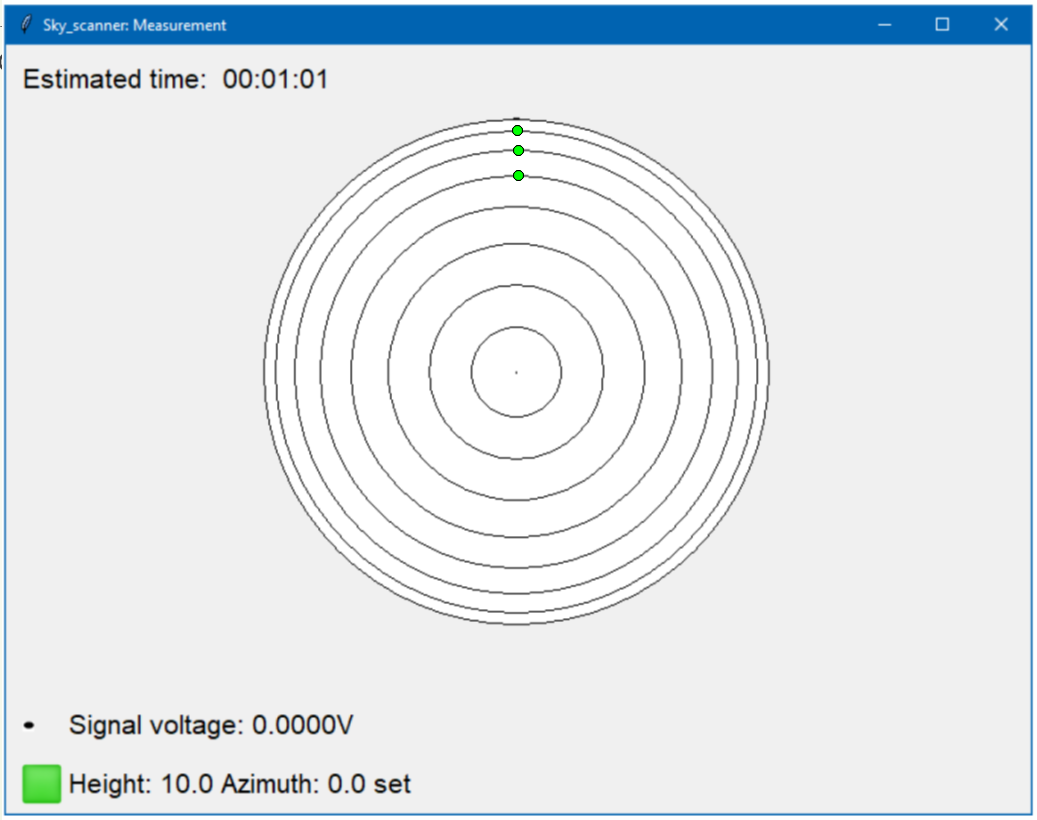
After starting the measurement, the progress in the measurement is displayed and an estimate of the remaining measurement time is also continuously made:
Since the 10 nm and 40 nm filter sets differ from each other in the range of spectral coverage, there are two versions of the GUI: for 10 nm filters and for 40 nm filters.